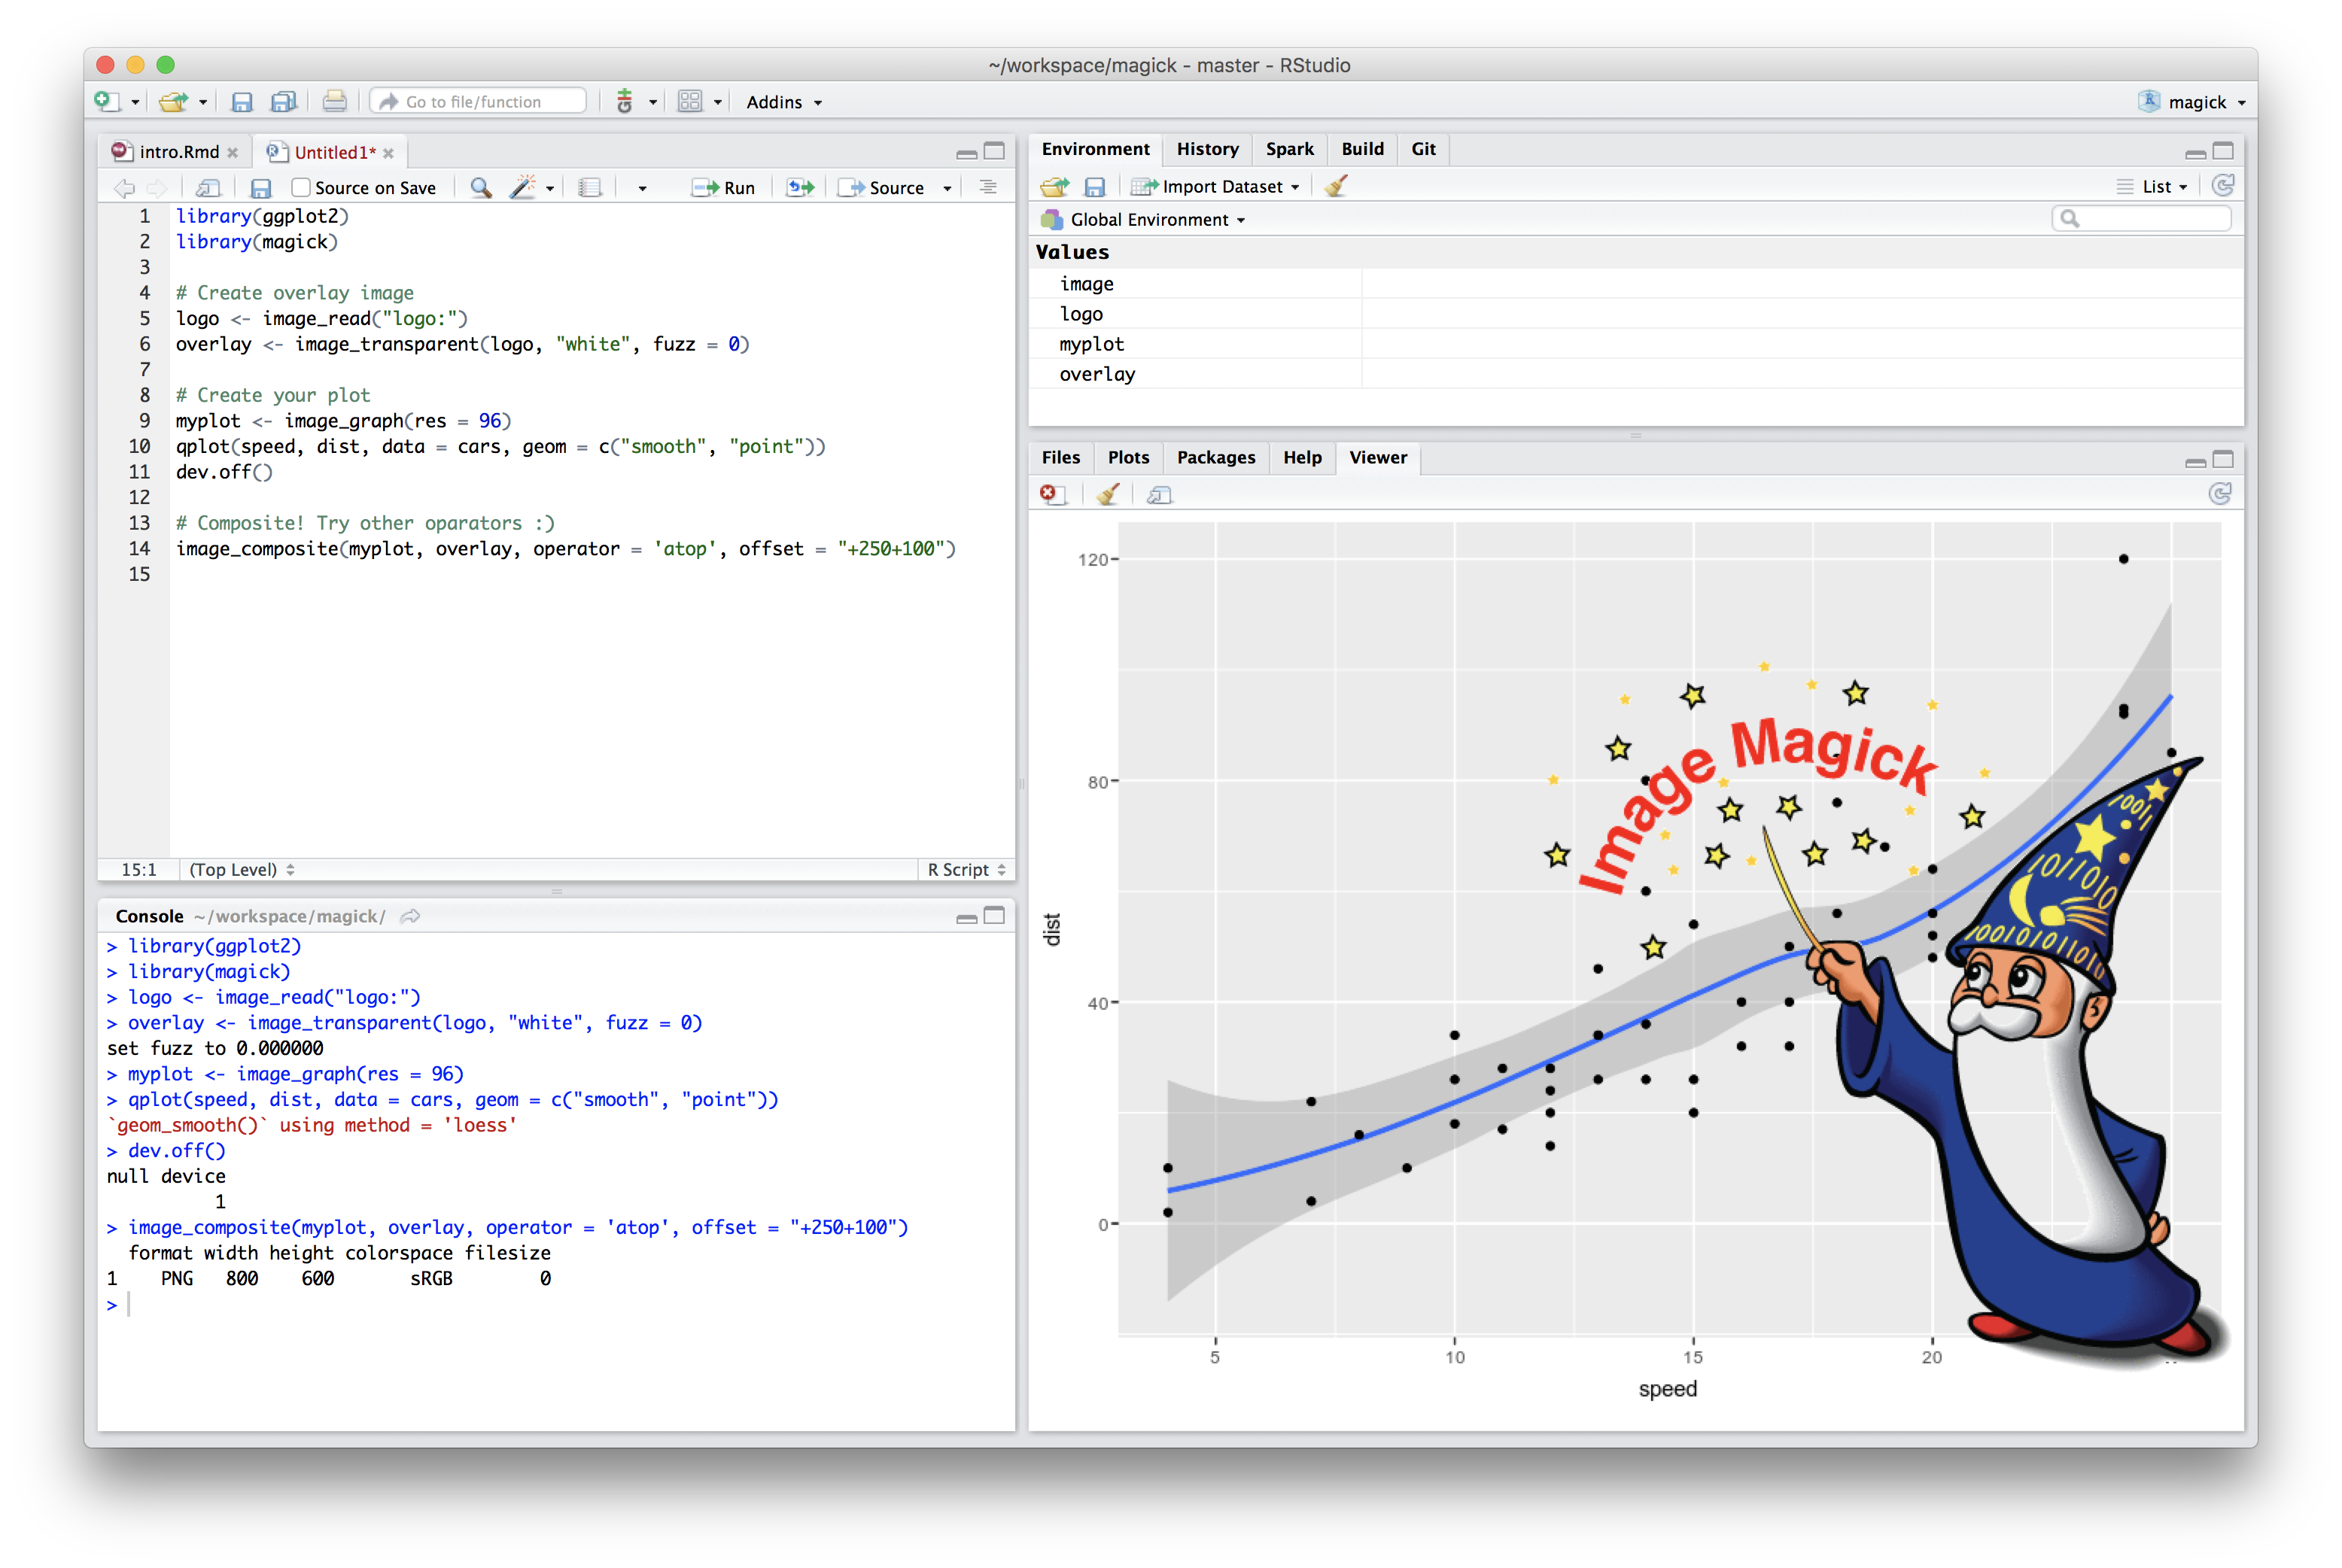
Last week, version 1.0 of the magick package appeared on CRAN: an ambitious effort to modernize and simplify high quality image processing in R. This R package builds upon the Magick++ STL which exposes a powerful C++ API to the famous ImageMagick library.
Since June, we have been highlighting the many projects that emerged from this year’s rOpenSci Unconf. These projects start many weeks before unconf participants gather in-person. Each year, we ask participants to propose and discuss project ideas ahead of time in a GitHub repo. This serves to get creative juices flowing as well as help people get to know each other a bit through discussion.
What is Taxonomy? Taxonomy in its most general sense is the practice and science of classification. It can refer to many things. You may have heard or used the word
taxonomy
used to indicate any sort of classification of things, whether it be companies or widgets. Here, we’re talking about biological taxonomy, the science of defining and naming groups of biological organisms.
Authors Eduardo Arino de la Rubia, Shannon E. Ellis, Julia Stewart Lowndes, Hope McLeod, Amelia McNamara, Michael Quinn, Elin Waring, Hao Zhu
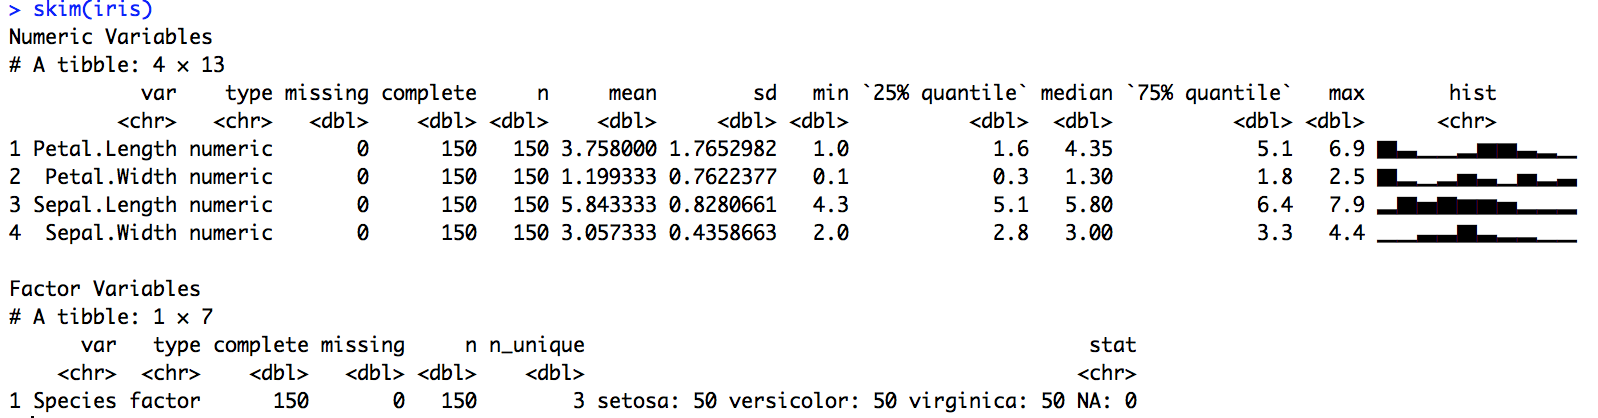
Like every R user who uses summary statistics (so, everyone), our team has to rely on some combination of summary functions beyond summary() and str(). But we found them all lacking in some way because they can be generic, they don’t always provide easy-to-operate-on data structures, and they are not pipeable. What we wanted was a frictionless approach for quickly skimming useful and tidy summary statistics as part of a pipeline.
We, Alicia Schep and MilesMcBain, drove the webrockets projectat #runconf17.To make progress we solicited code, advice, and entertaining anecdotesfrom a host of other attendees, whom we humbly thank for helping to makeour project possible. This post is divided into two sections: First up we’ll relate ourexperiences, prompted by some questions we wrote forone another.
Authors Becca Krouse, Erin Grand, Hannah Frick, Lori Shepherd, Sam Firke, William Ampeh
Before everybody made their way to the unconf via LAX and Lyft, attendees discussed potential project ideas online. The
packagemetrics
package was our answer to two related issues. The first proposal centered on creating and formatting tables in a reproducible workflow.
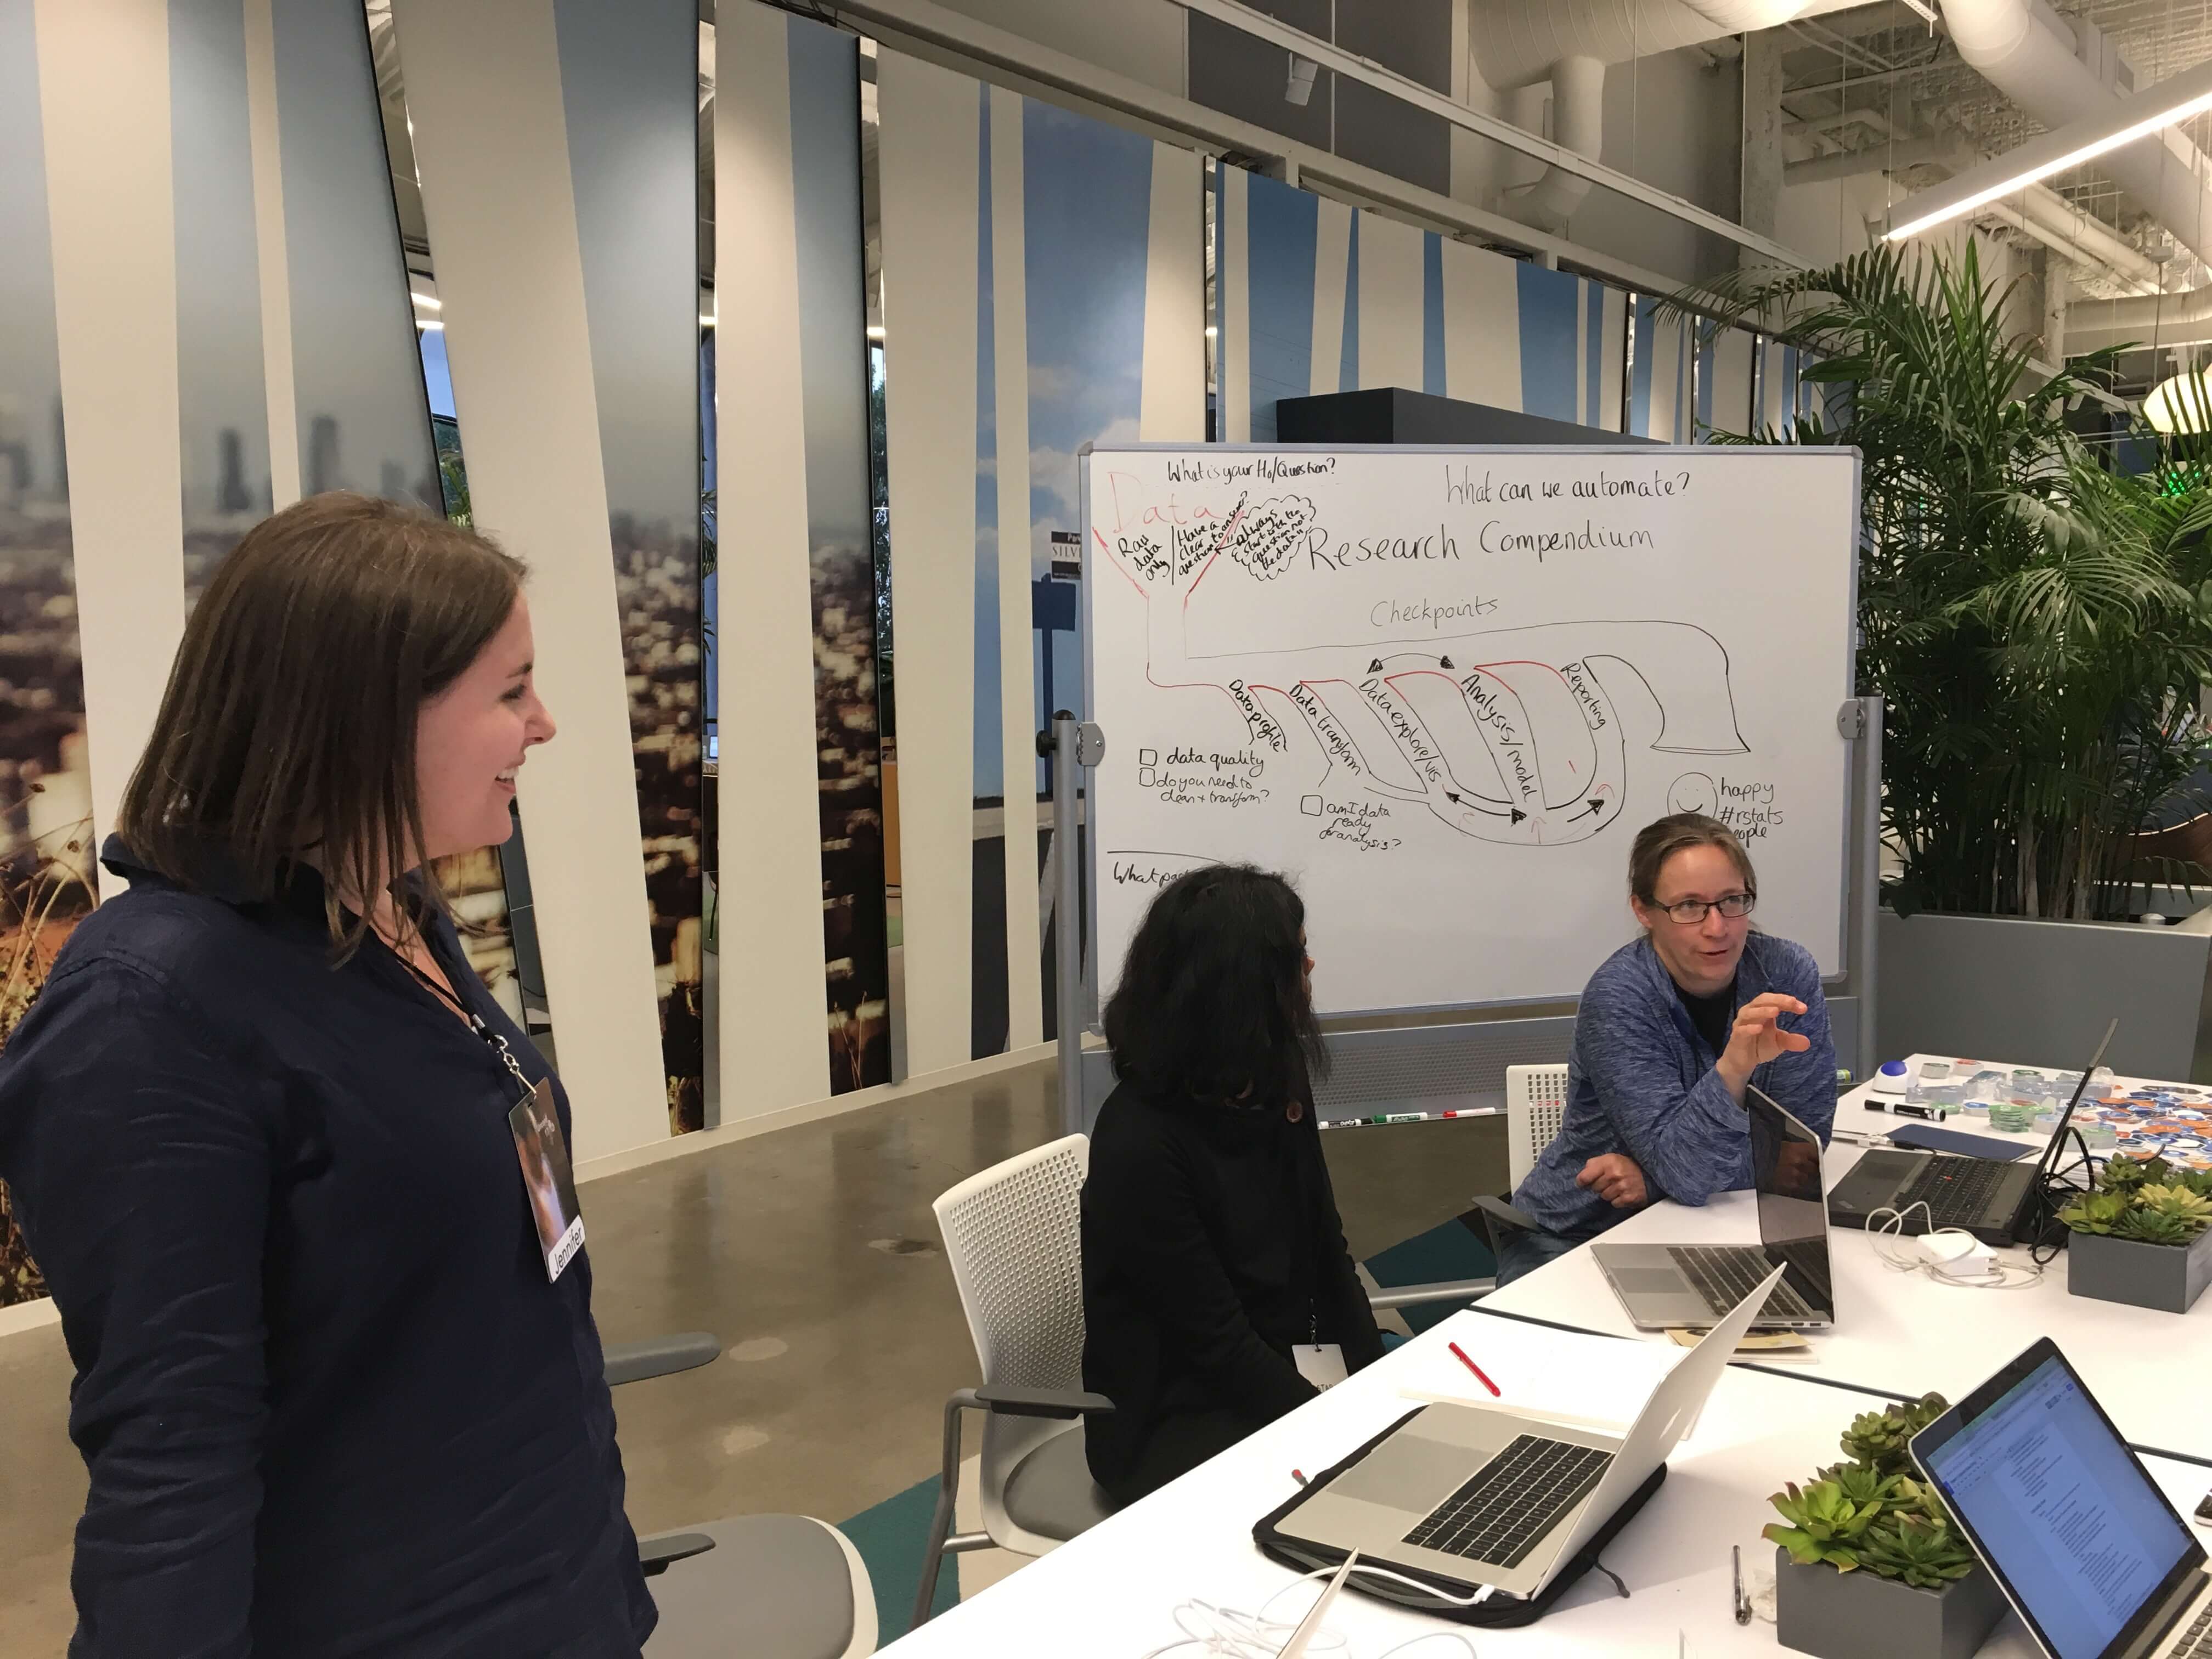
Authors Noam Ross, Alice Daish, Laura DeCicco, Molly Lewis, Nistara Randhawa, Jennifer Thompson, Nicholas Tierney
Two years ago at #runconf15, there was a great discussion about best practices for organizing R-based analysis projects that yielded a nice guidance document describing
research compendia
. Compendia, as we described them, were minimal products of reproducible research, using parts of R package structure to organize the inputs, analyses, and outputs of research projects.
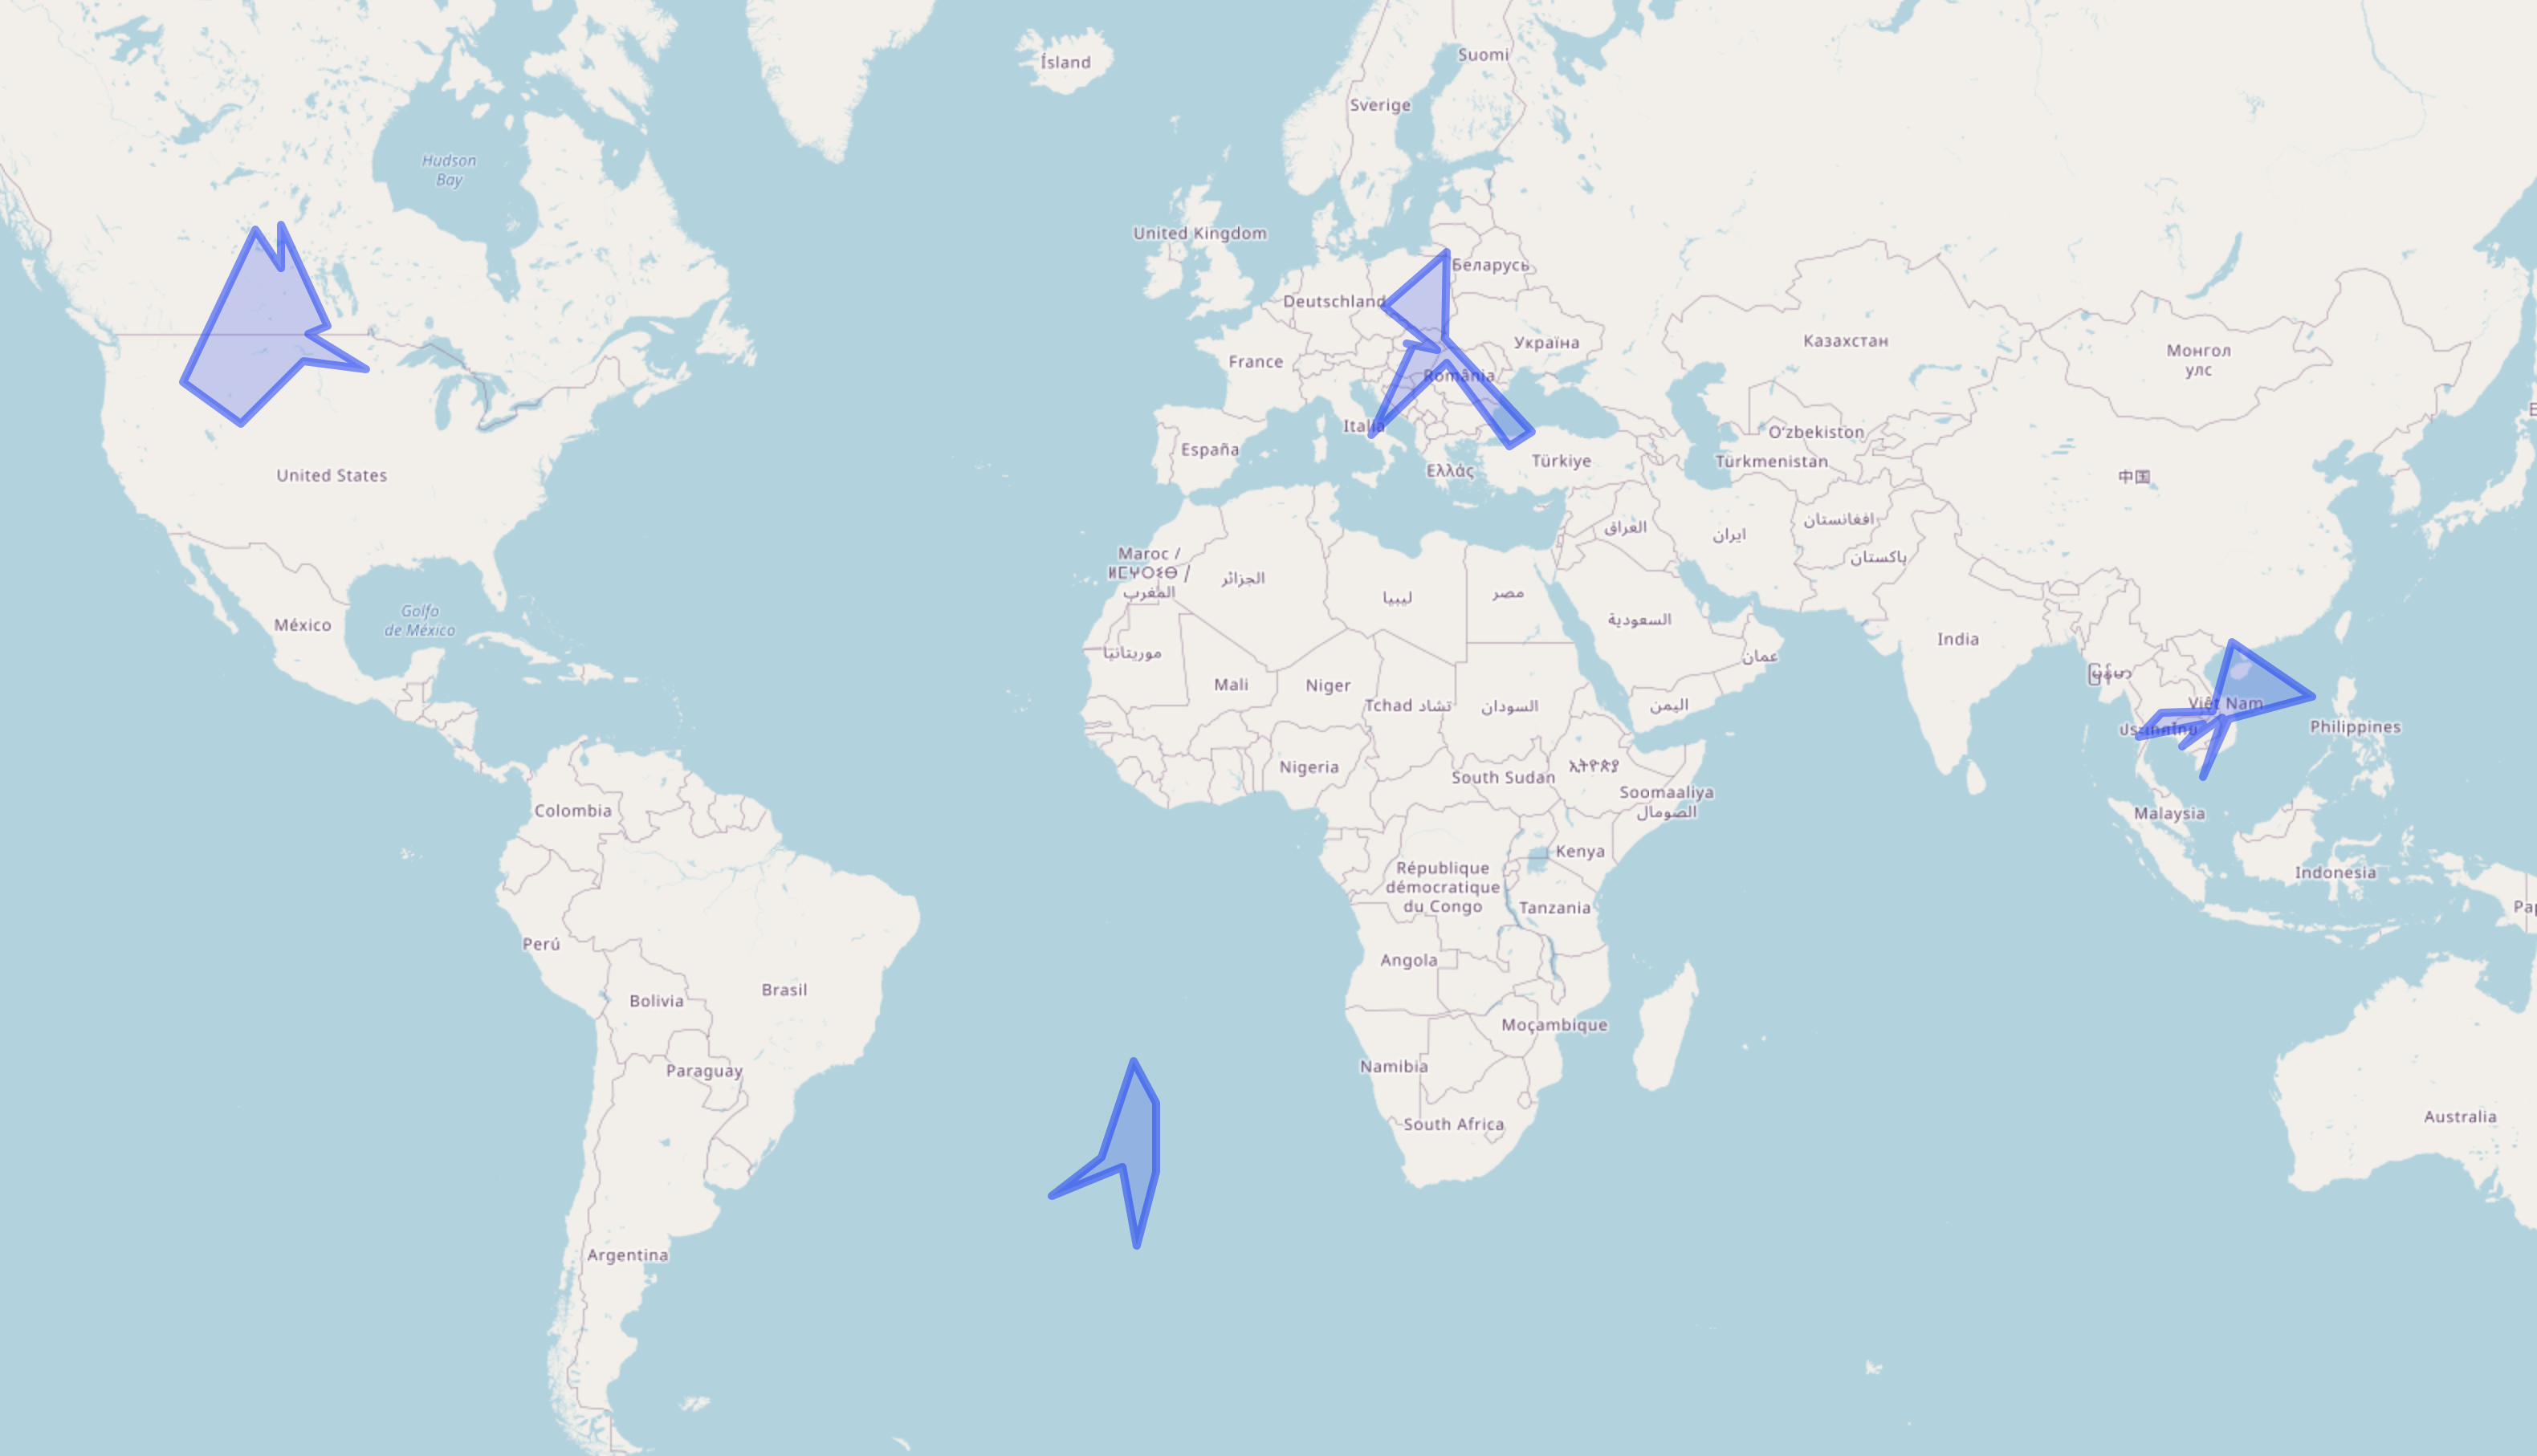
randgeo
generates random points and shapes in GeoJSON and WKT formats foruse in examples, teaching, or statistical applications. Points and shapes are generated in the long/lat coordinate system and withappropriate spherical geometry; random points are distributed evenly acrossthe globe, and random shapes are sized according to a maximum great-circledistance from the center of the shape.
There is no problem in science quite as frustrating as
other peoples’ data
. Whether it’s malformed spreadsheets, disorganized documents, proprietary file formats, data without metadata, or any other data scenario created by someone else, scientists have taken to Twitter to complain about it. As a political scientist who regularly encounters so-called “open data” in PDFs, this problem is particularly irritating.