Published
Author Mark Edmondson
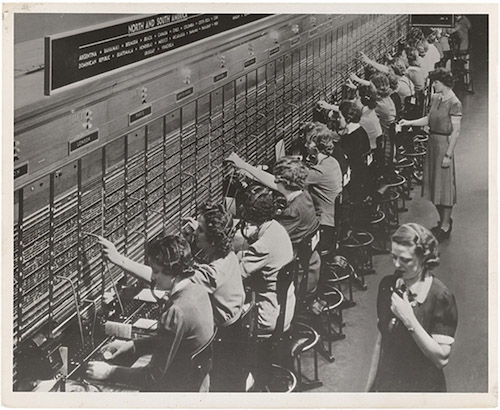
One of the greatest assets human beings possess is the power of speech and language, from which almost all our other accomplishments flow. To be able to analyse communication offers us a chance to gain a greater understanding of one another.