Computer and Information SciencesHugo

rOpenSci - open tools for open science

rOpenSci - open tools for open science
Open Tools and R Packages for Open Science
Home PageJSON Feed
language
Published
Author Kelly O'Briant

KO: What is your name, job title, and how long have you been using R? [Note: This interview took place in May 2017. Mara joined RStudio as their tidyverse developer advocate in November 2017.] MA: My name is Mara Averick, I do consulting, data science, I just say “data nerd at large” because I’ve seen those Venn diagrams and I’m definitely not a data scientist. I used R in high school for fantasy basketball.

Published
Author Nicholas Tierney

Just last week we organised the 2nd rOpenSci ozunconference, the sibling rOpenSci unconference, held in Australia. Last year it was held in Brisbane, this time around, the ozunconf was hosted in Melbourne, from October 26-27, 2017. At the ozunconf, we brought together 45 R-software users and developers, scientists, and open data enthusiasts from academia, industry, government, and non-profits.

Published
Author Kelly O'Briant

KO: What is your name, job title, and how long have you been using R? DS: My name is David Smith. I work at Microsoft and my self-imposed title is ‘R Community Lead’. I’ve been working with R specifically for about 10 years, but I’d been working with S since the early 90s. KO: How did you transition into using R? DS: I was using S for a long, long time, and I worked for the company that commercialized S, where I was a project manager for S-PLUS.

Published

One of rOpenSci’s aims is to build capacity of software users and developers and foster a sense of pride in their work. What better way to do that than to encourage you to participate in Hacktoberfest, a month-long celebration of open source software! It doesn’t take much to get involved Beginners to experts. Contributors and package maintainers welcome.

Published
Author Tim Trice

What is rrricanes Why Write rrricanes? There is a tremendous amount of weather data available on the internet. Much of it is in raw format and not very easy to obtain. Hurricane data is no different. When one thinks of this data they may be inclined to think it is a bunch of map coordinates with some wind values and not much else. A deeper look will reveal structural and forecast data.

Published
Authors Noam Ross, Scott Chamberlain, Karthik Ram, Maëlle Salmon

At rOpenSci, we create and curate software to help scientists with the data life cycle. These tools access, download, manage, and archive scientific data in open, reproducible ways. Early on, we realized this could only be a community effort. The variety of scientific data and workflows could only be tackled by drawing on contributions of scientists with field-specific expertise. With the community approach came challenges.

Published

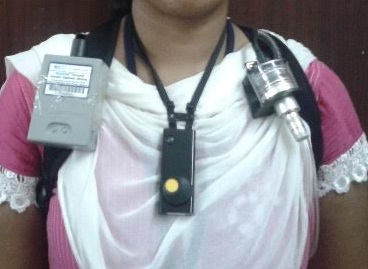
As you might remember from my blog post about ropenaq, I work as a data manager and statistician for an epidemiology project called CHAI for Cardio-vascular health effects of air pollution in Telangana, India. One of our interests in CHAI is determining exposure, and sources of exposure, to PM2.5 which are very small particles in the air that have diverse adverse health effects.