Published
Author Matt Sundquist
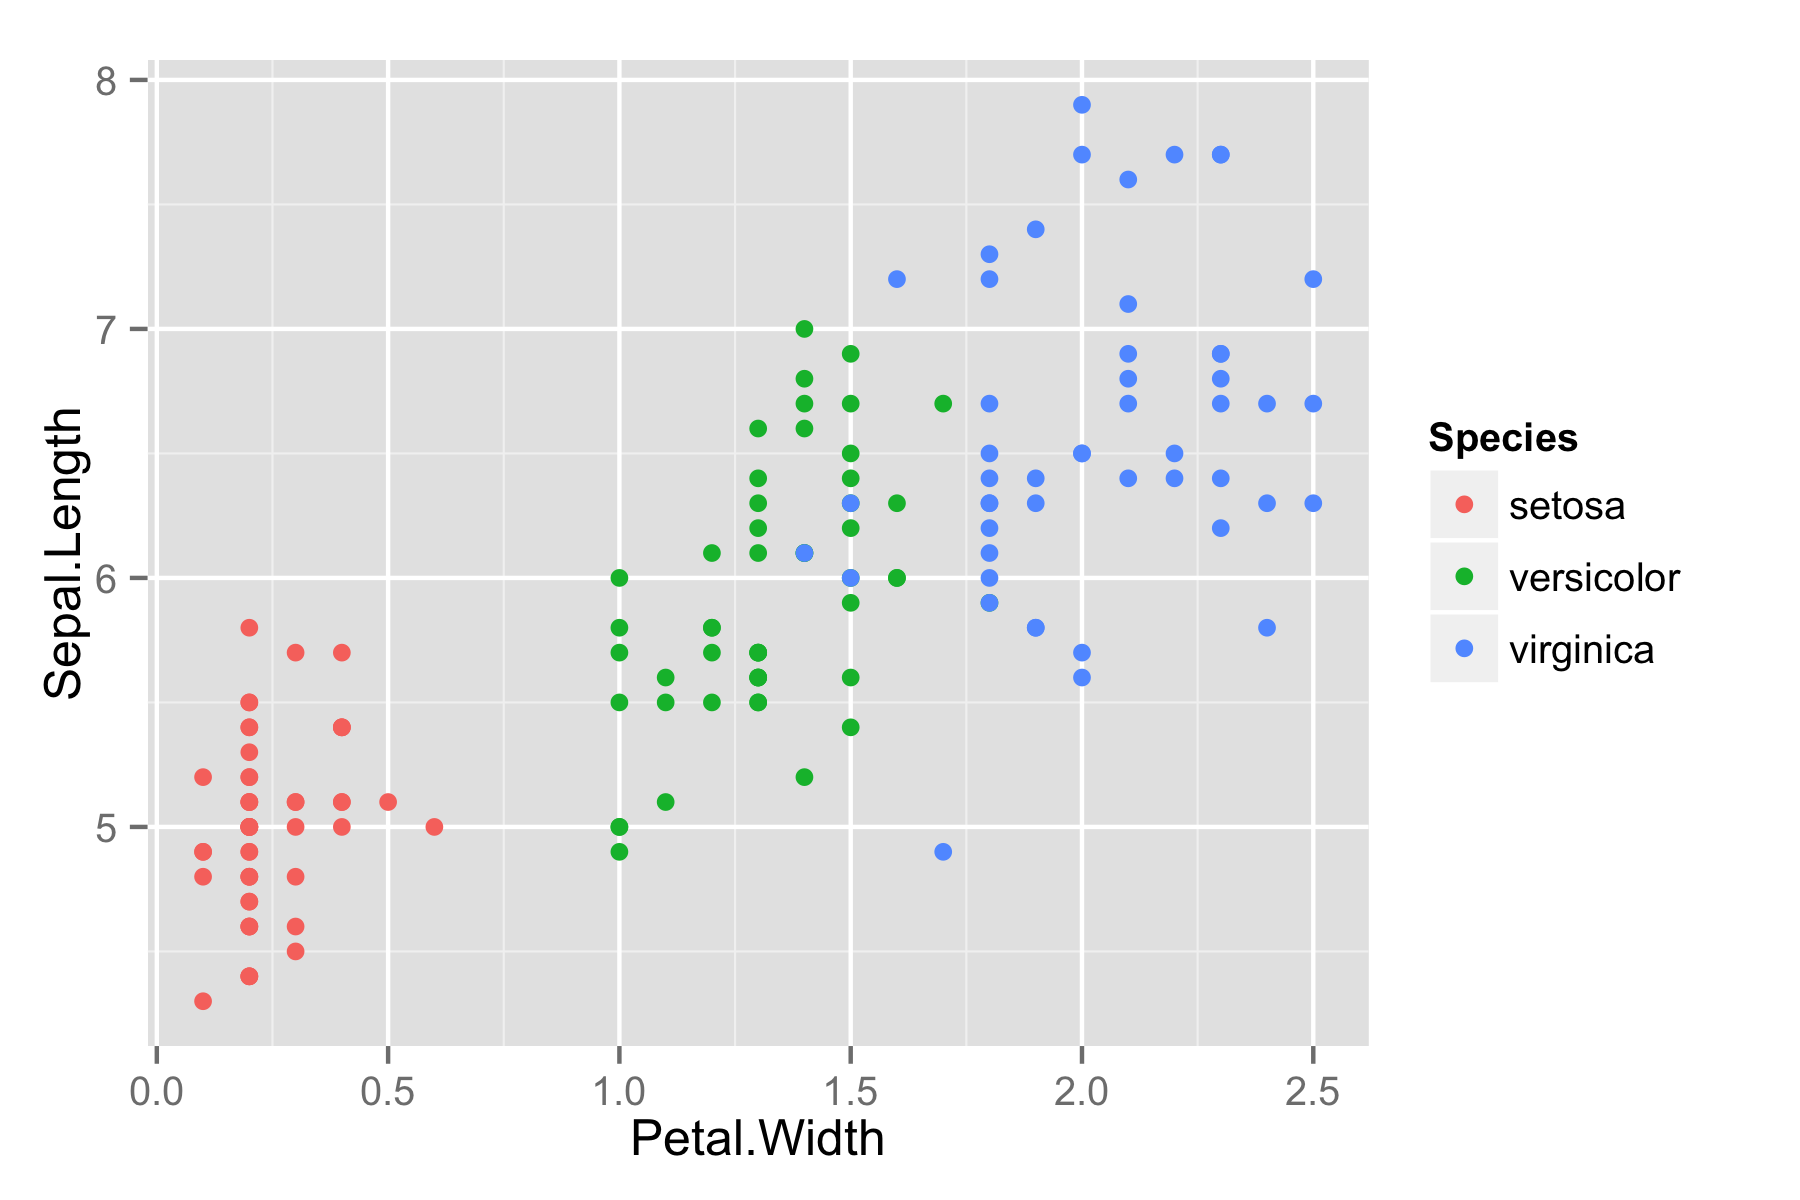
Editor’s note: This is a guest post by Matt Sundquist from Plot.ly. Ggplotly and Plotly’s R API let you make ggplot2 plots, add py$ggplotly(), and make your plots interactive, online, and drawn with D3. Let’s make some.1. Getting Started and Examples Here is Fisher’s iris data.library("ggplot2")ggiris <- qplot(Petal.Width, Sepal.Length, data = iris, color = Species)print(ggiris) Let’s make it in Plotly.