mapscanner It is sometimes easy in the midst of the cutting-edge world of uniquesoftware development that is rOpenSci to forget that even though oursoftware might be freely available from anywhere in the world, access toadequate hardware is often restricted.

Editor’s note: This is a guest post by Matt Sundquist from Plot.ly. Ggplotly and Plotly’s R API let you make ggplot2 plots, add py$ggplotly(), and make your plots interactive, online, and drawn with D3. Let’s make some.1. Getting Started and Examples Here is Fisher’s iris data.library("ggplot2")ggiris <- qplot(Petal.Width, Sepal.Length, data = iris, color = Species)print(ggiris) Let’s make it in Plotly.
We have previously written about creating interactive maps on the web from R, with the interactive maps on Github. See here, here, here, and here. A different approach is to use CartoDB, a freemium service with sql interface to your data tables that provides a map to visualize data in those tables.
Previously on this blog we have discussed making geojson maps and uploading to Github for interactive visualization with USGS BISON data, and with GBIF data, and on my own personal blog. This is done using a file format called geojson , a file format based on JSON (JavaScript Object Notation) in which you can specify geographic data along with any other metadata.

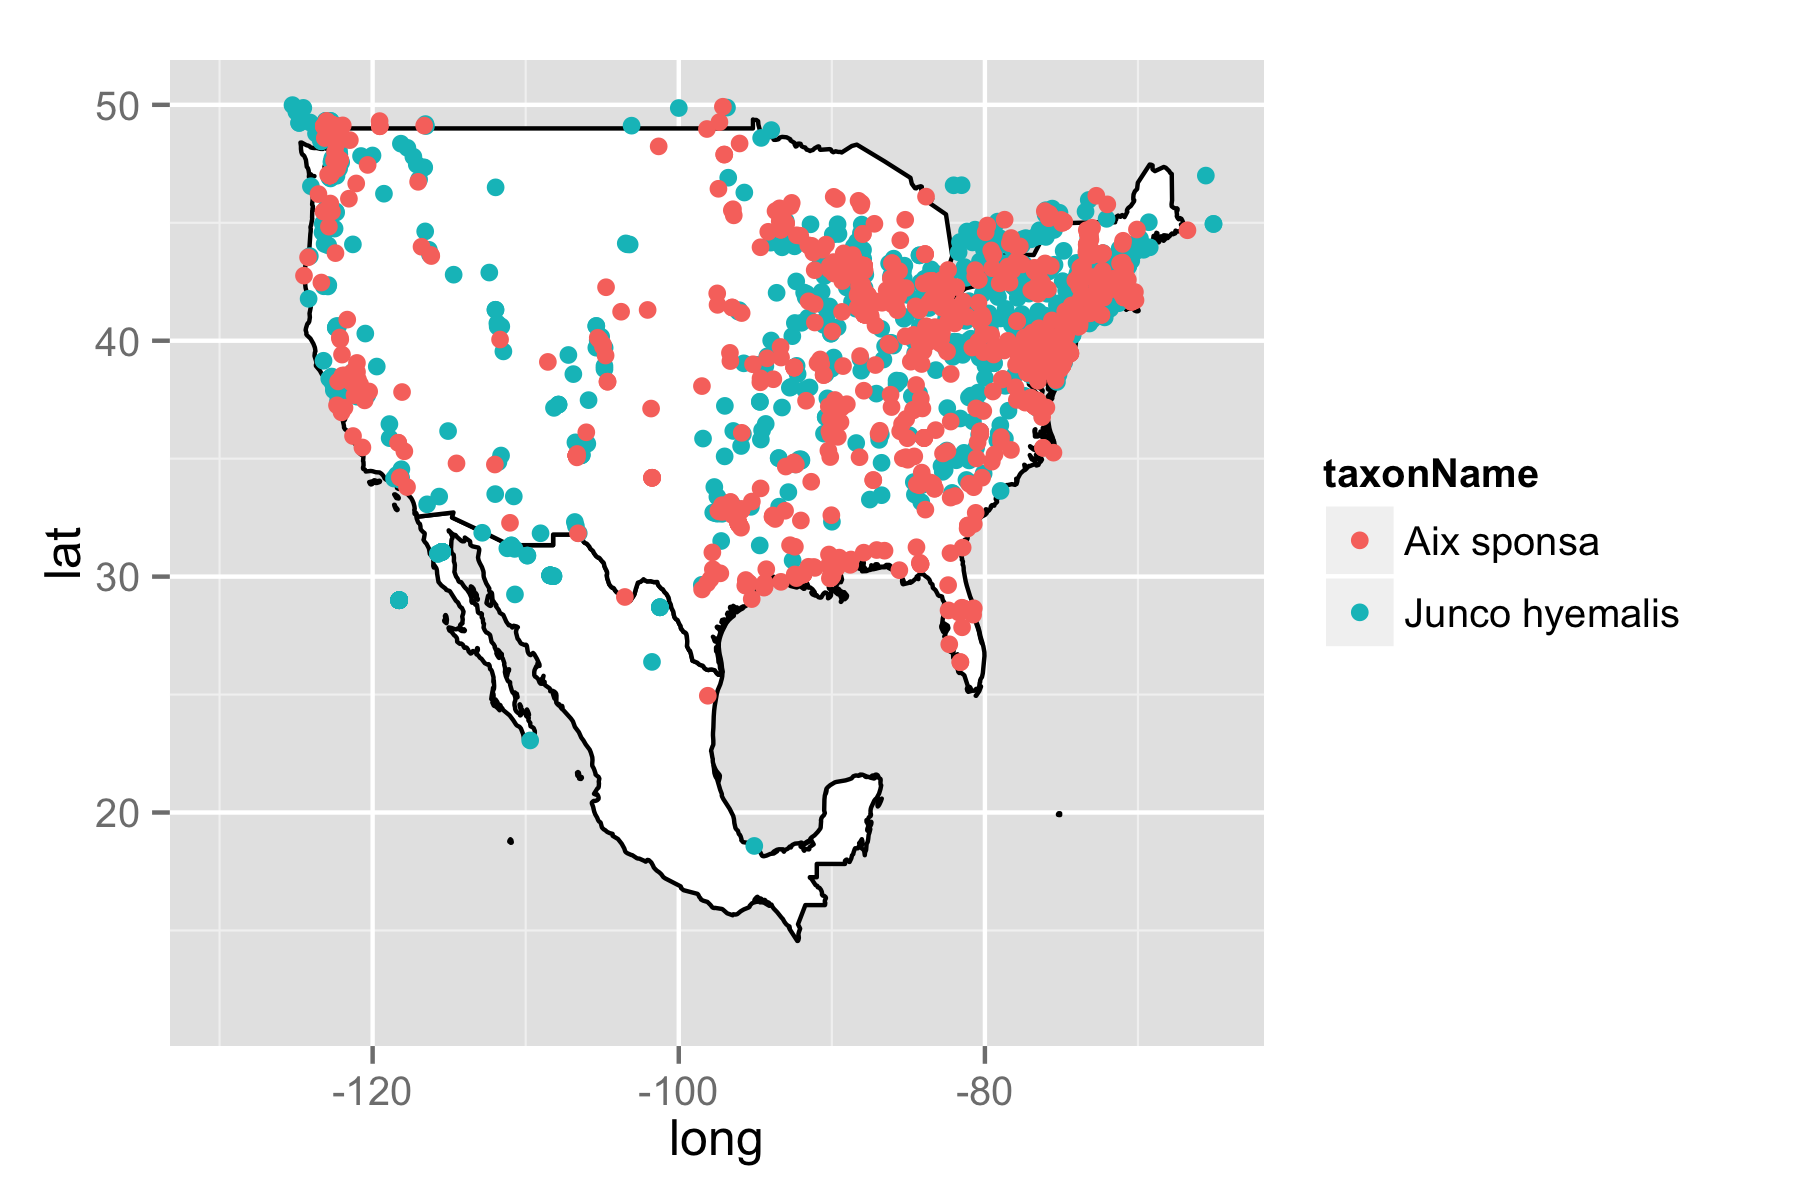
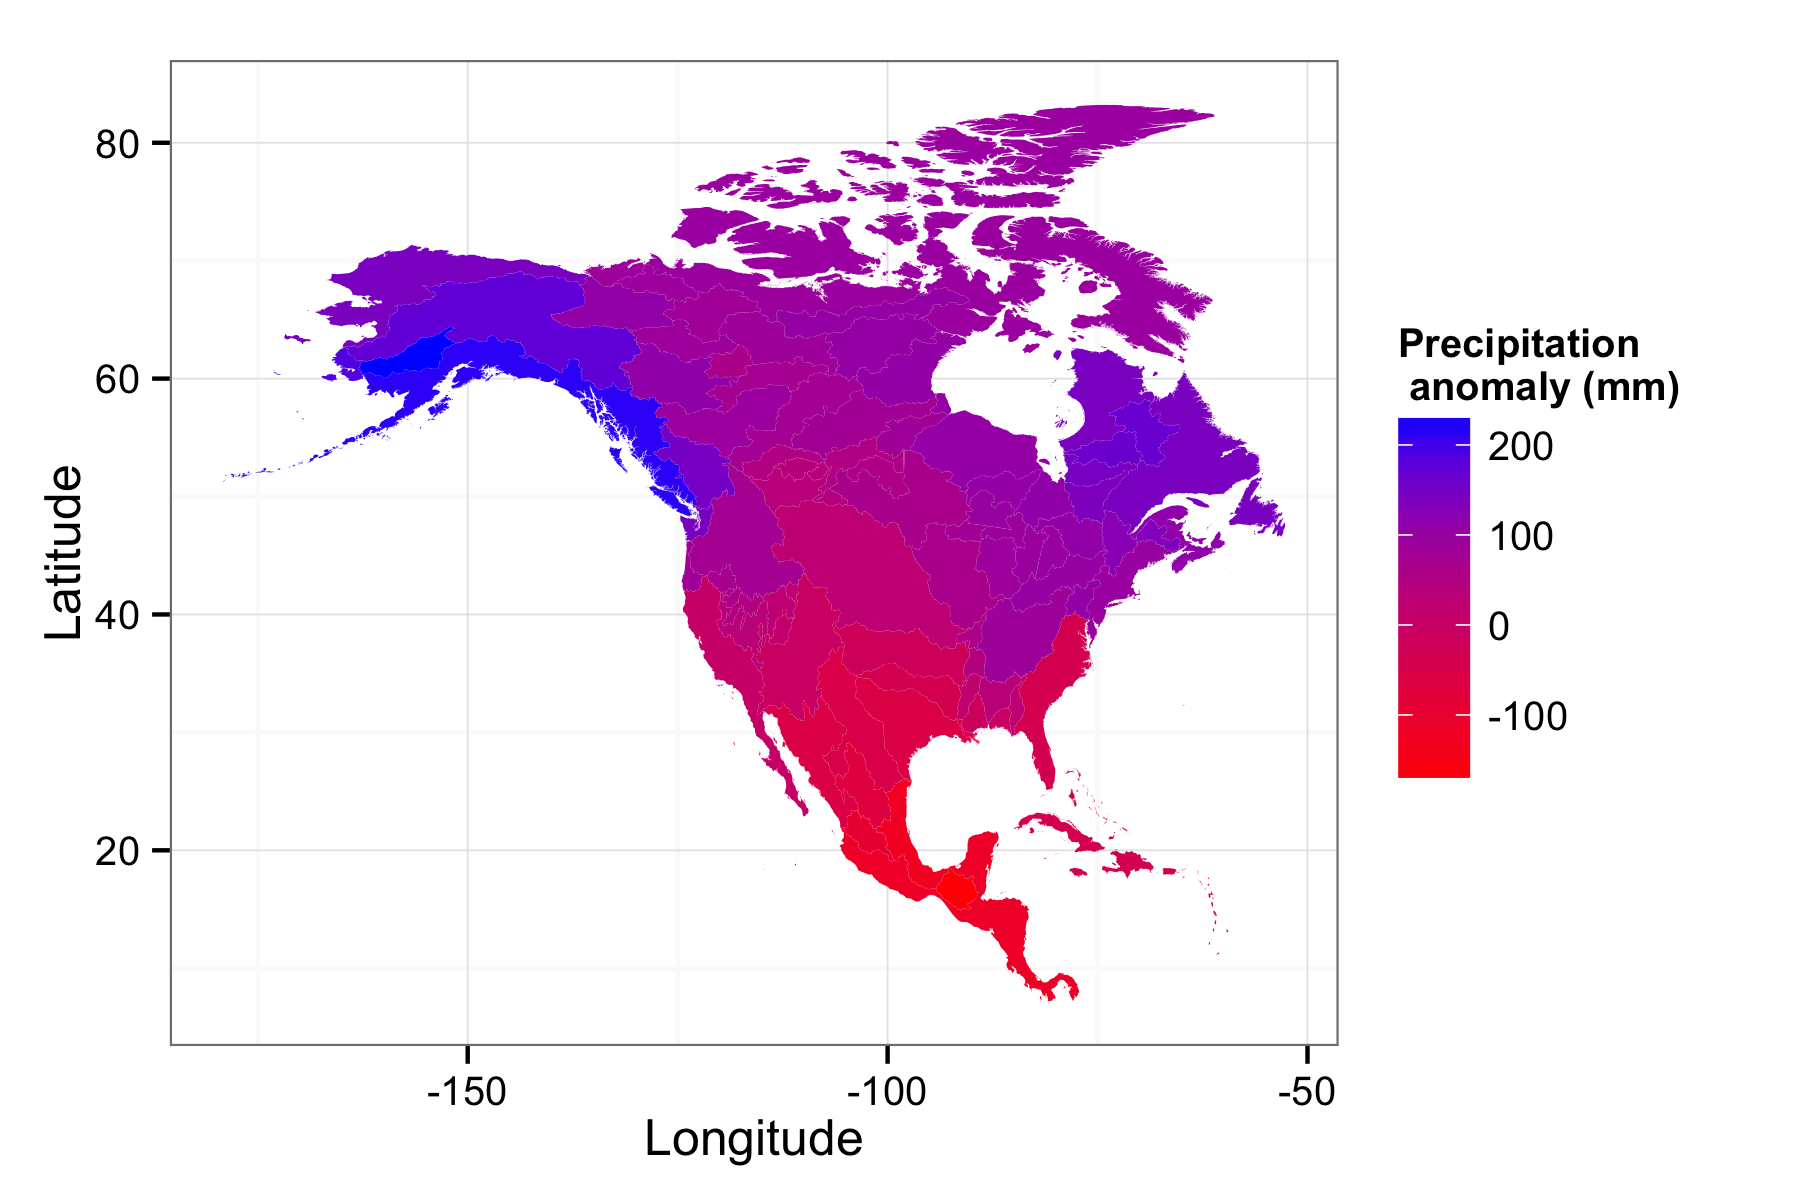
One of our primary goals at ROpenSci is to wrap as many science API’s as possible. While each package can be used as a standalone interface, there’s lots of ways our packages can overlap and complement each other. Sure He-Man usually rode Battle Cat, but there’s no reason he couldn’t ride a my little pony sometimes too. That’s the case with our packages for GBIF and the worldbank climate data api.

A recent video on the PBS Ideas Channel posited that the discovery of climate change is humanities greatest scientific achievement. It took synthesizing generations of data from thousands of scientists, hundreds of thousands (if not more) of hours of computer time to run models at institutions all over the world. But how can the individual researcher get their hands of some this data?
Previously on this blog and on my own personal blog, I have discussed how easy it is to create interactive maps on Github using a combination of R, git and Github. This is done using a file format called geojson , a file format based on JSON (JavaScript Object Notation) in which you can specify geographic data along with any other metadata.