Computer and Information SciencesWordPress

quantixed

quantixed
x == (s || z). You say it kwontized
Home PageAtom FeedMastodon
language
Published

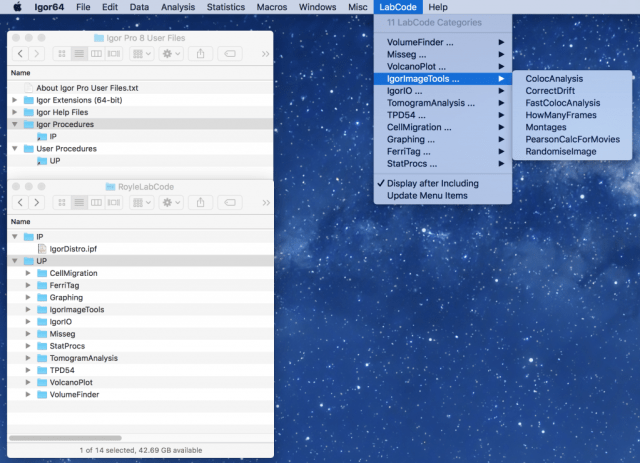
This post is something of a “how to” guide. The problem is how can you share code with a small team and keep it up-to-date? For ImageJ, the solution is simple. You can make an ImageJ update site and then push any updated code to the user when they startup ImageJ. For IgorPro, there is no equivalent. Typically I send ipf files to someone and they run the code, but I have to resend them whenever there’s an update.

Published

I’ve previously written about Google Scholar. Its usefulness and its instability. I just read a post by Jon Tennant on how to harvest Google Scholar data in R and I thought I would use his code as the basis to generate some nice plots based on Google Scholar data. A script for R is below and can be found here. Graphics are base R but do the job. First of all I took it for a spin on my own data.

Published

My activity on twitter revolves around four accounts. I try to segregate what happens on each account, and there’s inevitably some overlap. But what about overlap in followers? What lucky people are following all four? How many only see the individual accounts? It’s quite easy to look at this in R. So there are 36 lucky people (or bots!) following all four accounts.

Published

I read about Antonio Sánchez Chinchón’s clever approach to use the Travelling Salesperson algorithm to generate some math-art in R. The follow up was even nicer in my opinion, Pencil Scribbles. The subject was Boris Karloff as the monster in Frankenstein. I was interested in running the code (available here and here), so I thought I’d run it on a famous scientist.

Published

Many projects in the lab involve quantifying circular objects. Microtubules, vesicles and so on are approximately circular in cross section. This quick post is about how to find the diameter of these objects using a computer. So how do you measure the diameter of an object that is approximately circular? Well, if it was circular you would measure the distance from one edge to the other, crossing the centre of the object.

Published

Another post using R and looking at Twitter data. As I was typing out a tweet, I had the feeling that my vocabulary is a bit limited. Papers I tweet about are either “great”, “awesome” or “interesting”. I wondered what my most frequently tweeted words are. Like the last post you can (probably) do what I’ll describe online somewhere, but why would you want to do that when you can DIY in R? First, I requested my tweets from Twitter.

Published

In the UK there is an advertising disclaimer that “the value of your investments may go down as well as up.” Since papers are our main commodity in science and citations are something of a return, surely the “value” of a published paper only ever increases over time. Doesn’t it? I think this is true when citations to a paper are tracked at a conventional database (Web of Science for example). Citations are added and very rarely taken away.

Published

To validate our analyses, I’ve been using randomisation to show that the results we see would not arise due to chance. For example, the location of pixels in an image can be randomised and the analysis rerun to see if – for example – there is still colocalisation. A recent task meant randomising live cell movies in the time dimension , where two channels were being correlated with one another.