Computer and Information SciencesWordPress

quantixed

quantixed
x == (s || z). You say it kwontized
Home PageAtom FeedMastodon
language
Published

Having recently got my head around violin plots, I thought I would explain what they are and why you might want to use them. There are several options when it comes to plotting summary data. I list them here in order of granularity, before describing violin plots and how to plot them in some detail. Bar chart This is the mainstay of most papers in my field.

Published

I was talking to a speaker visiting our department recently. While discussing his postdoc work from years ago, he told me about the identification of the sperm factor that causes calcium oscillations in the egg at fertilisation. It was an interesting tale because the group who eventually identified the factor – now widely accepted as PLCzeta – had earlier misidentified the factor, naming it oscillin.

Published

Last week, ALM (article-level metric) data for PLoS journals were uploaded to Figshare with the invitation to do something cool with it. Well, it would be rude not to. Actually, I’m one of the few scientists on the planet that hasn’t published a paper with Public Library of Science (PLoS), so I have no personal agenda here. However, I love what PLoS is doing and what it has achieved to disrupt the scientific publishing system.

Published

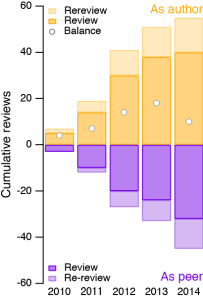
A colleague once told me that they only review three papers per year and then refuse any further requests for reviewing. Her reasoning was as follows: I publish one paper a year (on average) This paper incurs three peer reviews Therefore, I owe “the system” three reviews. It’s difficult to fault this logic. However, I think that as a senior scientist with a wealth of experience, the system would benefit greatly from more of her input.

Published

My post on the strange data underlying the new impact factor for eLife was read by many people. Thanks for the interest and for the comments and discussion that followed. I thought I should follow up on some of the issues raised in the post. To recap: eLife received a 2013 Impact Factor despite only publishing 27 papers in the last three months of the census window. Other journals, such as Biology Open did not.

Published

I noticed something strange about the 2013 Impact Factor data for eLife . Before I get onto the problem. I feel I need to point out that I dislike Impact Factors and think that their influence on science is corrosive. I am a DORA signatory and I try to uphold those principles. I admit that, in the past, I used to check the new Impact Factors when they were released, but no longer.

Published

What does the life cycle of a scientific paper look like? It stands to reason that after a paper is published, people download and read the paper and then if it generates sufficient interest, it will begin to be cited. At some point these citations will peak and the interest will die away as the work gets superseded or the field moves on. So each paper has a useful lifespan.

Published

This post is about a paper that was recently published. It was the result of a nice collaboration between me and Francisco López-Murcia and Artur Llobet in Barcelona. The paper in a nutshell The availability of clathrin sets a limit for presynaptic function Background Clathrin is a three legged protein that forms a cage around membranes during endoctosis.