Published
Author Roderic Page
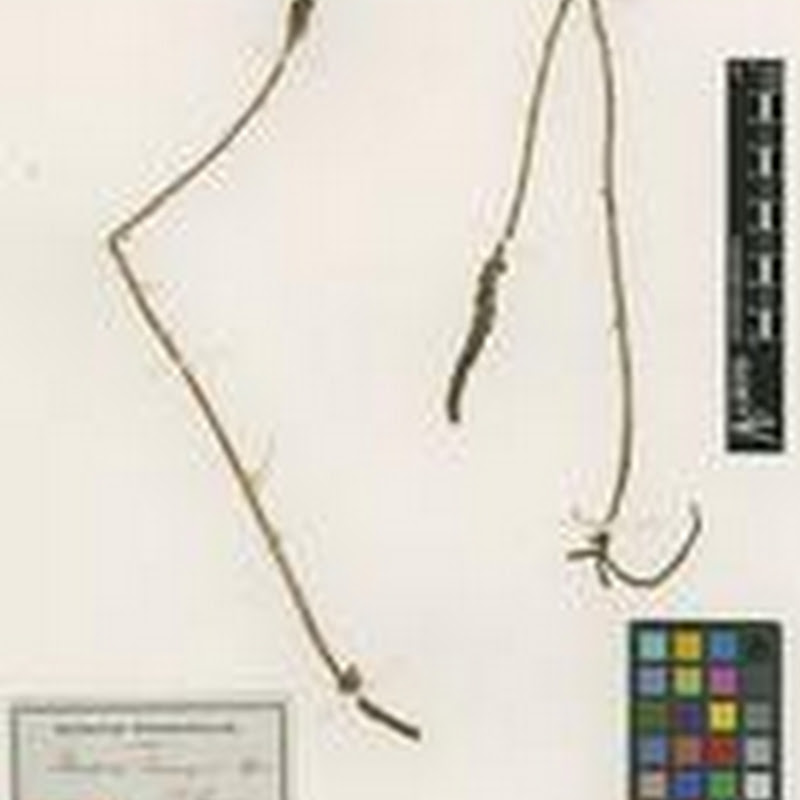
Somehow I get the feeling that botanists haven't got the "open data" religion. Not only is the list of plant names list behind a really bad license, but the Global Plants Initiative (GPI) hides its type images behind a JSTOR Plant Sciences paywall.