Published
Author Roderic Page
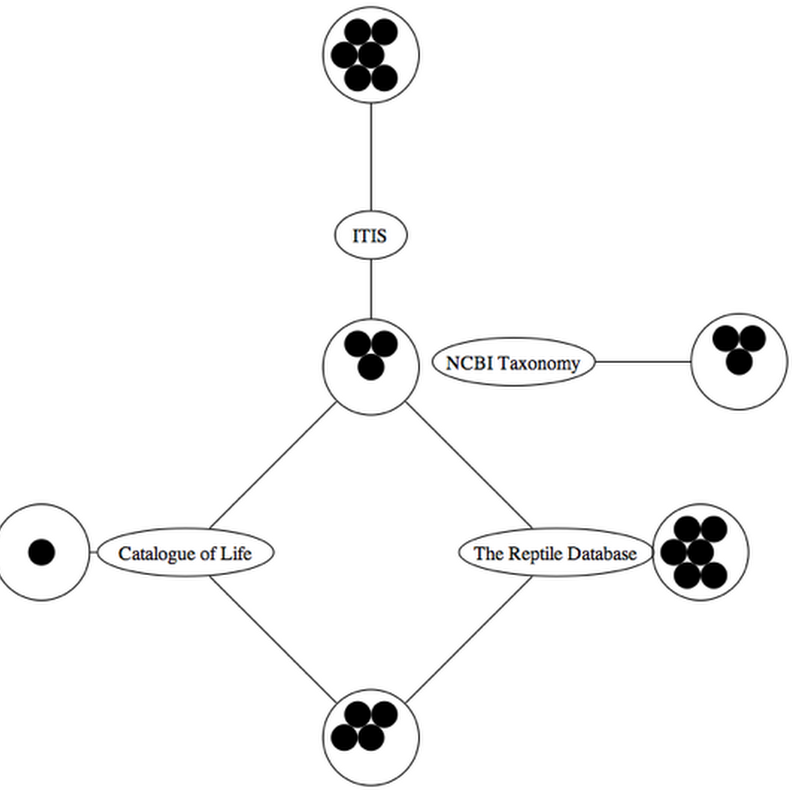
As part of a project to build a tool to navigate through taxonomic names and classifications I've become interested in quick ways to compare classifications.
As part of a project to build a tool to navigate through taxonomic names and classifications I've become interested in quick ways to compare classifications.
One of the things I find frustrating about TreeBASE is that there's no easy way to get an overview of what it contains. What is it's taxonomic coverage like? Is it dominated by plants and fungi, or are there lots of animal trees as well?
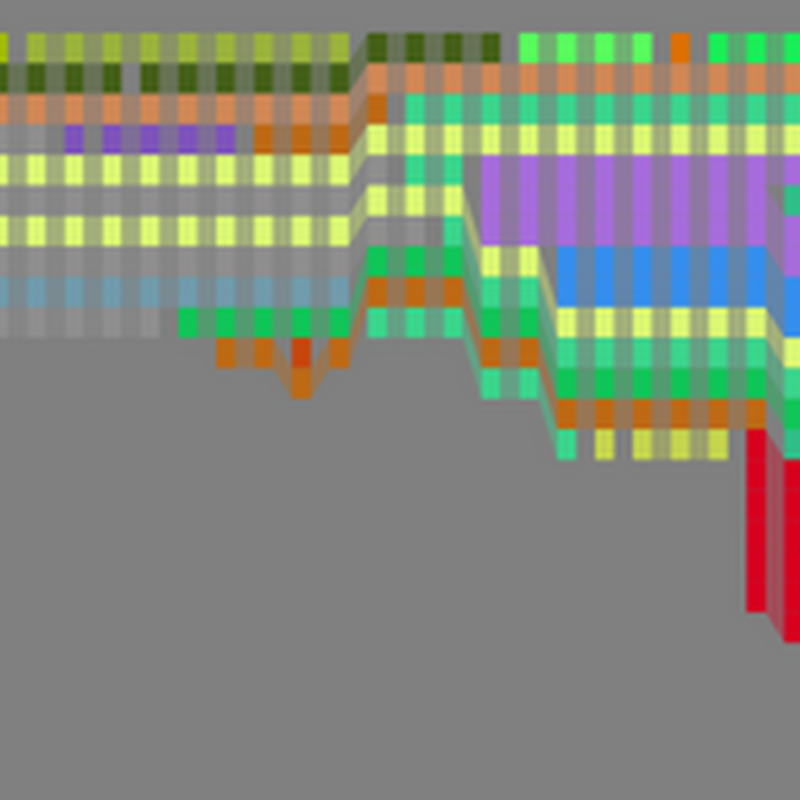
Inspired by a comment on my post Visualising edit history of a Wikipedia page, the code I use to make history flow diagrams like the one below is now in GitHub at https://github.com/rdmpage/wikihistoryflow.There is also a live version at http://iphylo.org/~rpage/wikihistoryflow.
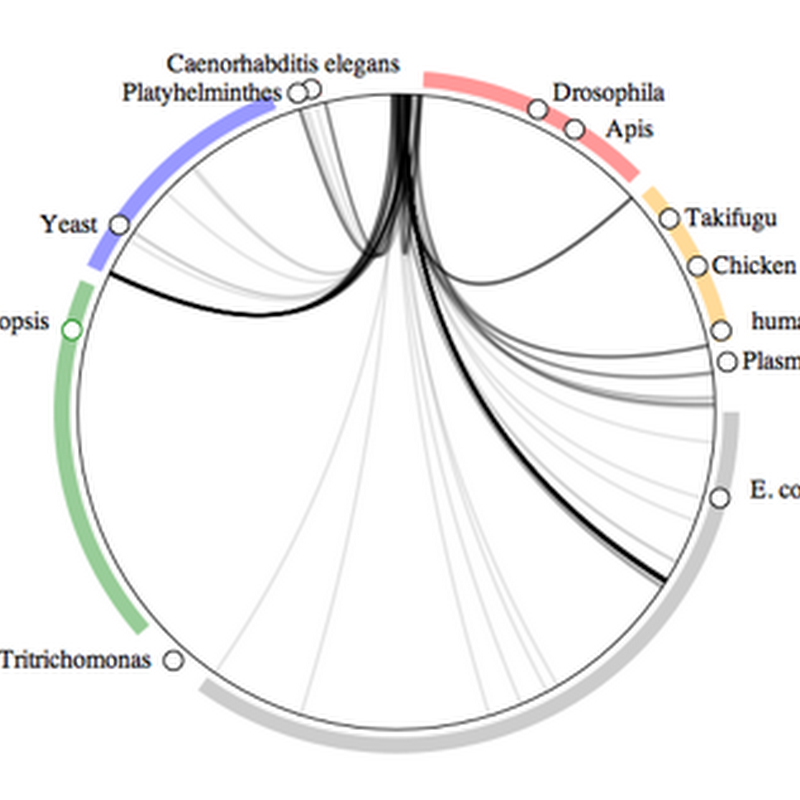
One side effect of playing with ways to visualise and integrate biology databases is that you stumble across the weird and wonderful stuff that living organisms get up to. My earliest papers were on crustacean taxonomy, so I thought I'd try my latest toy on them. What lives on crustaceans? The "symbiome" graph for crustacea shows a range of associations, including marine bacteria ( Vibrio ), fungi (microsporidians), and other
Given that the Twitter stream tagged #vizbi will fade away soon, I've grabbed most of the links I tweeted during VIZBI 2011 and have put them here.

I've spent the last three days at VIZBI, a Workshop on Visualizing Biological Data, held at the Broad Institute in Boston (note that "Broad" rhymes with "Code"). A great conference in a special venue that includes the DNAtrium. Videos of the talks will be online "real soon now", look for the keynotes, which were full of great ideas and visualisations.
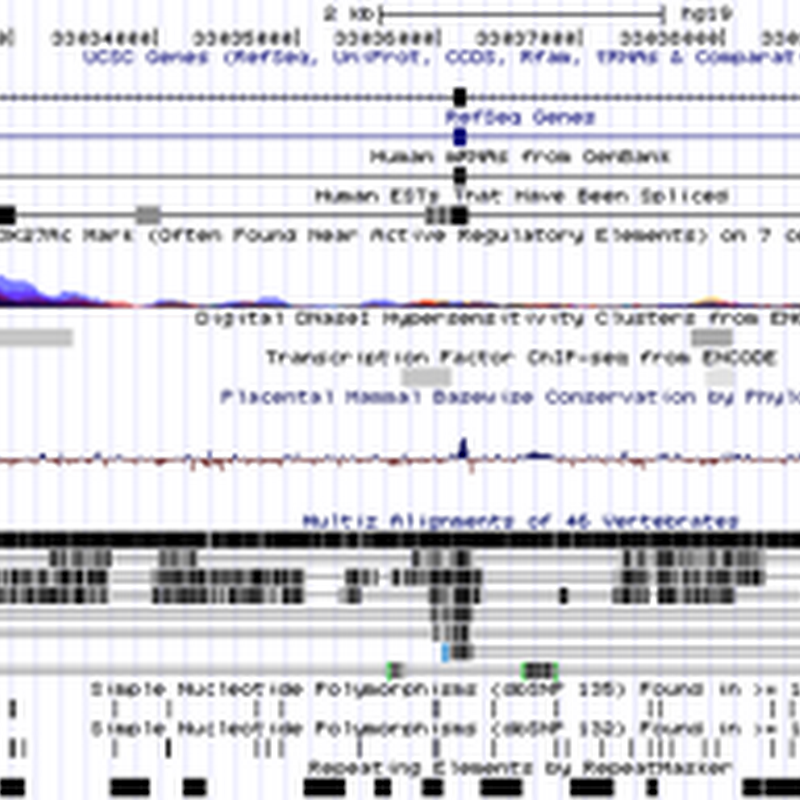
More zoom viewer experiments (see previous post), this time with a linked map that updates as you browse the tree (SVG-capable browser required). As you browse the frog classification the map updates to show the location of georeferenced sequences in GenBank from the taxa in the part of the tree you are looking at. The map is limited to not more than 200 localities, and many frog sequences aren't georeferenced, but it's a fun way to combine
Continuing experiments with a zoom viewer for large trees (see previous post), I've now made a demo where the labels are clickable. If the NCBI taxon has an equivalent page in Wikipedia the demo displays and link to that page (and, if present, a thumbnail image). Give it a try athttp://iphylo.org/~rpage/deeptree/3.htmlor watch the short video clip below: Zoomable viewer with Wikipedia thumbnails from Roderic Page on Vimeo.
My views on TreeBASE are pretty well known. Lately I've been thinking a lot about how to "fix" TreeBASE, or indeed, move beyond it. I've made a couple of baby steps in this direction.The first step is that I've created a group for TreeBASE papers on Mendeley.

Having made a first stab at mapping NCBI taxa to Wikipedia, I thought it might be fun to see what could be done with it. I've always wanted to get quantum treemaps working (quantum treemaps ensure that the cells in the treemap are all the same size, see my 2006[!] blog post for further description and links). After some fussing I have some code that seems to do the trick.